


In this article, we will look at ways in which the “quality” of a profile can be numerically quantified, together with a green-amber-red idea for colour coding of sites; the intensity of which will be based on the numerical value obtained. For this purpose, we consider the ratio of the Majestic SEO quality metrics, namely, the ratio of the Citation to the Trust Flow, applied to the Majestic Million domains. We will use the boxplot scheme to determine the reasonable values of this ratio, as well as to determine outliers and extreme values.
As described in Comparing Moz and Majestic SEO Metrics with Boxplots post, reasonable values of this ratio are those that lie between the inner fences. Outliers are those data points that lie between the inner and outer fences, and extreme values lie beyond the outer fences. For the purposes of this study, we compute the ratio of the Citation to Trust Flow of all domains in the Majestic Million, and use the statistics derived from this sample as a template for quantifying the quality of a domain. If the Trust Flow is zero anywhere, we set the ratio to a very large value. A typical boxplot for the data is shown in Figure 1.
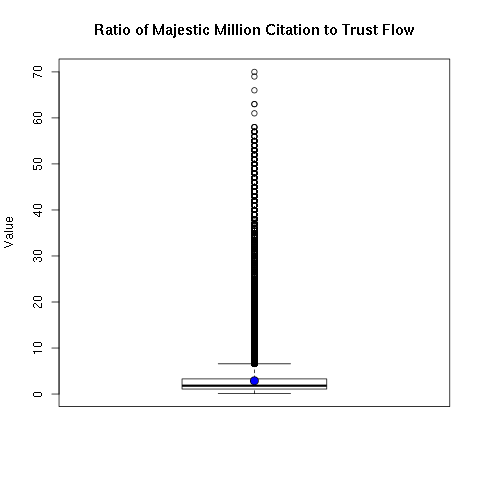
Figure 1: Boxplot of the ratio of Citation to Trust Flow for the Majestic Million Data
Note the large number of outliers that lie towards the upper fences. Typical values for the summary statistics (after discarding those points where the Trust Flow is zero, and consequently the ratio is infinity) are as follows:
| Minimum | 0.083333333 |
| 1st Quartile | 1.090909091 |
| Median | 1.8125 |
| Mean | 2.885966718 |
| 3rd Quartile | 3.285714286 |
| Maximum | 70 |
| Interquartile Range | 2.194805195 |
| Upper Inner Fence | 6.577922078 |
| Lower Inner Fence | -2.2012987 |
| Upper Outer Fence | 9.87012987 |
| Lower Outer Fence | -5.49350649 |
It may be noted that all values of the ratio are positive. Since the minimum value is greater than the value for the lower inner fence, there are no outliers below the minimum. Thus, values closer to zero (indicating a higher Trust Flow) are rated higher than those further away. The methodology for a colour-coding scheme is as follows:
- Points that lie between the minimum and the upper inner fence are assumed to be “reasonable” (green);
- Data lying between the upper inner fence and the upper outer fence are considered outliers (amber), and
- Points above the upper outer fence are considered “extreme values” (red).
Let us see how this would work in practice. To demonstrate this method, we will randomly choose two sites each from the Majestic Million data which have been categorized using this method as “reasonable” (green), outliers (amber) and extreme points (red), and display their link profiles.
“Reasonable” Profiles:
The link profiles of sites that were classified as reasonable based on the Citation-to-Trust Flow ratio look like those shown in Figure 2 below.
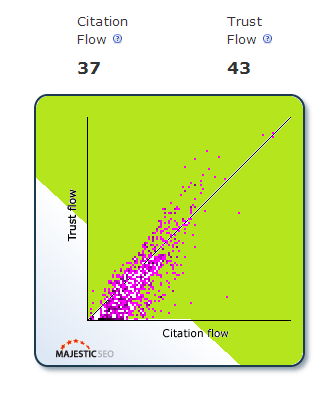
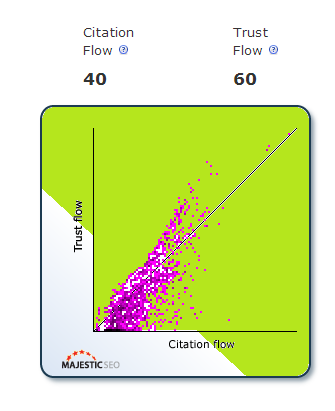
Figure 2: “Reasonable” Profiles
Note that there is an almost even distribution of the Citation and Trust flows about the central line. In most of these cases, the Trust Flow tends to be greater than the Citation Flow.
Outliers:
The link profiles for sites categorized as outliers have the appearance as shown in Figure 3.
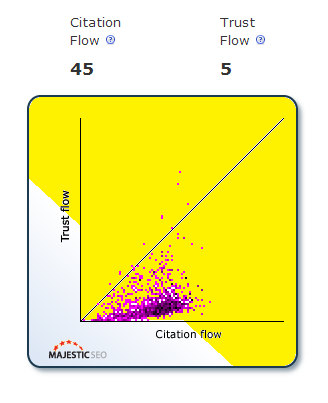
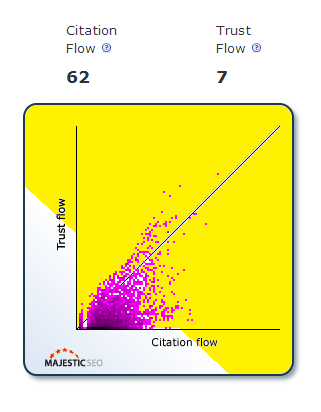
Figure 3: Sites Classified as Outliers
While not as evenly distributed about the central line, these profiles still do have values that extend upwards along the Trust Flow axis, although the concentration of values (indicated by the darker regions on the charts) lie lower on the Trust Flow axis and tend to spread out along the Citation Flow axis.
Extreme Points:
Figure 4 shows link profiles that have been classified as extreme points.
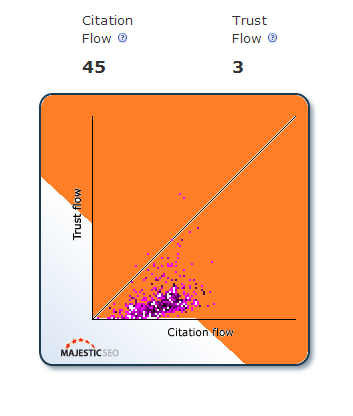
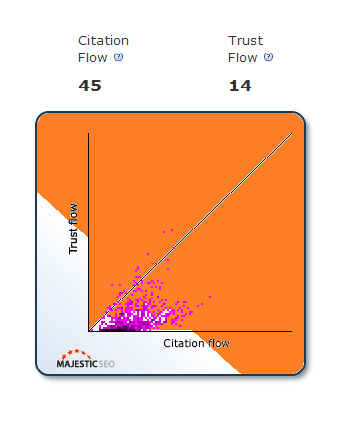
Figure 4: Sites Classified as Extreme Points
Note the extremely poor and sparse link profiles.
A statistical summary is shown graphically in Figure 5. Note how the mean Trust Flow decreases while the Citation/Trust ratio increases as we move from Green to Red.
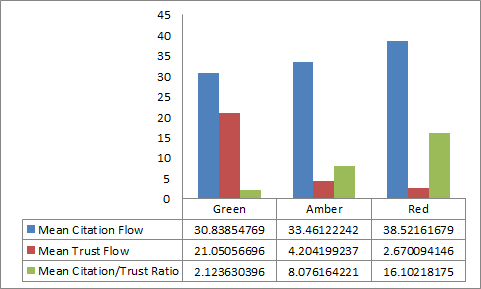
Figure 5: Chart displaying the Mean Citation Flow, Trust Flow and Citation/Trust Ratio for Green, Amber and Red Profiles
Conclusions:
We have initiated a mechanism that could potentially be used to categorize sites based on a colour-coding scheme, using the value of the ratio of Citation to Trust Flow as a proxy for the “quality” of a profile. However, one setback of this method is that sites with equal magnitudes of Citation and Trust Flow would be rated equal, even though both are at a very low level. Further studies need to be carried out on whether to incorporate referring subnets into this procedure, so as to dampen the effect of link farms coming out of the same data centre.
- Ranking of Top Data Scientists on Twitter using MajesticSEO’s Metrics - August 19, 2014
- Measuring Twitter Profile Quality - August 14, 2014
- PageRank, TrustFlow and the Search Universe - July 7, 2014
studied and learnt, I don’t quite understand this two indicators of MajesticSEO well, until one day a friend of mine told me I could understand the TF as “how important these sites are” and CF as “how many sites have voted you”. Look forward to your further study, good topic.
December 21, 2013 at 2:04 pmHow Trust ratio is calculated. Is it (Trust flow/Citation flow)? If yes, can we determine url’s on the basis of trust ratio to be good or bad.
February 13, 2014 at 7:29 amHi Pawan:
We use the ratio of Citation Flow/ Trust Flow. The closer this value is to zero, the better the URL is.
February 13, 2014 at 9:35 am